
6.5 KiB
Udacity Data Engineer Nanodegree - Capstone Project
Project Summary
We'll work with four datasets to complete the project. The main dataset will include data on immigration to the United States, and supplementary datasets will include data on airport codes, U.S. city demographics, and temperature data.
The project follows the follow steps:
- Step 1: Scope the Project and Gather Data
- Step 2: Explore and Assess the Data
- Step 3: Define the Data Model
- Step 4: Run ETL to Model the Data
- Step 5: Complete Project Write Up
Step 1: Scope the Project and Gather Data
Scope
This project will integrate I94 immigration data, world temperature data and US demographic data to setup a data warehouse with fact and dimension tables.
-
Data Sets
-
Tools
- AWS S3: data storage
- Python for data processing
- Pandas - exploratory data analysis on small data set
- PySpark - data processing on large data set
Describe and Gather Data
| Data Set | Format | Description |
|---|---|---|
| I94 Immigration Data | SAS | Data contains international visitor arrival statistics by world regions and select countries (including top 20), type of visa, mode of transportation, age groups, states visited (first intended address only), and the top ports of entry (for select countries). |
| World Temperature Data | CSV | This dataset is from Kaggle and contains monthly average temperature data at different country in the world wide. |
| U.S. City Demographic Data | CSV | This dataset contains information about the demographics of all US cities and census-designated places with a population greater or equal to 65,000. |
Step 2: Explore and Assess the Data
Explore the Data
- Use pandas for exploratory data analysis to get an overview on these data sets
- Split data sets to dimensional tables and change column names for better understanding
- Utilize PySpark on one of the SAS data sets to test ETL data pipeline logic
Cleaning Steps
- Transform arrdate, depdate from SAS time format to pandad.datetime
- Parse description file to get auxiliary dimension table - country_code, city_code, state_code, mode, visa
- Tranform city, state to upper case to match city _code and state _code table
Please refer to Capstone_Project.ipynb.
(This step was completed in Udacity workspace as pre-steps for building up and testing the ETL data pipeline. File paths should be modified if notebook is run locally.)
Step 3: Define the Data Model
Conceptual Data Model
Since the purpose of this data lake is for BI app usage, we will model these data sets with star schema data modeling.
-
Star Schema
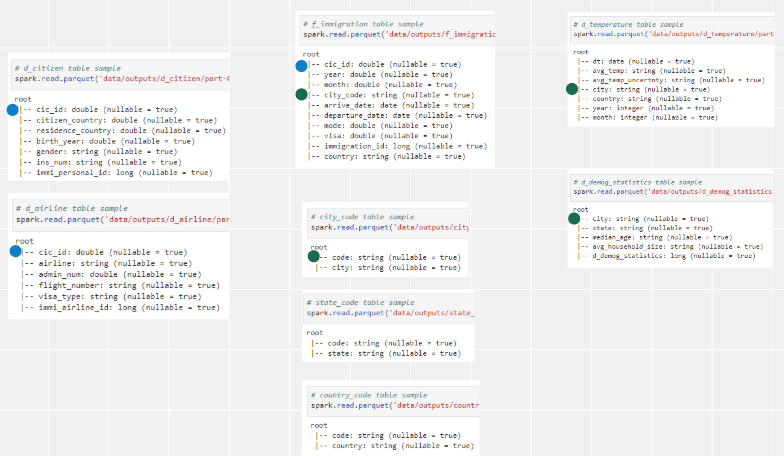

Data Pipeline Build Up Steps
- Assume all data sets are stored in S3 buckets
- Follow by Step 2 – Cleaning step to clean up data sets
- Transform immigration data to 1 fact table and 2 dimension tables, fact table will be partitioned by
state_code - Parsing label description file to get auxiliary tables
- Transform temperature data to dimension table
- Split demography data to 2 dimension tables
- Store these tables back to target S3 bucket
Step 4: Run Pipelines to Model the Data
Please refer to etl.py.
4.1 Create the data model
Data processing and data model was created by Spark.
Please refer to Capstone_Project.ipynb.
4.2 Data Quality Checks
Data quality checks includes
- No empty table after running ETL data pipeline
- Data schema of every dimensional table matches data model
Please refer to Quality-checks.ipynb.
4.3 Data dictionary
Please refer to Capstone_Project.ipynb.
Step 5: Complete Project Write Up
Tools and Technologies
- AWS S3 for data storage
- Pandas for sample data set exploratory data analysis
- PySpark for large data set data processing to transform staging table to dimensional table
Data Update Frequency
- Tables created from immigration and temperature data set should be updated monthly since the raw data set is built up monthly.
- Tables created from demography data set could be updated annually since demography data collection takes time and high frequent demography might take high cost but generate wrong conclusion.
- All tables should be update in an append-only mode.
Future Design Considerations
-
The data was increased by 100x.
If Spark with standalone server mode can not process 100x data set, we could consider to put data in AWS EMR which is a distributed data cluster for processing large data sets on cloud
-
The data populates a dashboard that must be updated on a daily basis by 7am every day.
Apache Airflow could be used for building up a ETL data pipeline to regularly update the date and populate a report. Apache Airflow also integrate with Python and AWS very well. More applications can be combined together to deliever more powerful task automation.
-
The database needed to be accessed by 100+ people.
AWS Redshift can handle up to 500 connections. If this SSOT database will be accessed by 100+ people, we can move this database to Redshift with confidence to handle this request. Cost/Benefit analysis will be needed if we are going be implement this cloud solution.
Future Improvements
There are several incompletions within these data sets. We will need to collect more data to get accurate.
-
Immigration data set is based at 2016 but temperature data set only get to 2013 which is not enough for us to see the temperature change at 2016.
-
Missing state and city in label description file. This makes it hard to join immigration tables and demography tables.